Introducing the Mobile Deployment Database: PolicyTracker’s new tool to see how spectrum is actually used
We've launched a new service that answers a question our licence data alone has never been able to: once an operator holds a slice of spectrum, do they actually deploy it?
The Mobile Deployment Database (MDD) combines two independently collected datasets. The first is PolicyTracker’s own Spectrum Database, compiled from official regulator and operator announcements and covering licensed and allocated spectrum across around 120 countries. The second is crowdsourced network deployment data from Teragence, synthesising 2.4 billion data points and covering 43 European countries, updated quarterly.
Brought together, they show not just which mobile spectrum band has been licensed in a given market, but the extent to which operators have actually put it to use, band by band, technology by technology.
The core metric is the number of base station sectors in which an operator’s equipment is transmitting on a specific band and technology, referred to as the number of deployments or radios.
The MDD answers questions that were previously difficult to research systematically, including whether licensed spectrum is genuinely being deployed, how urban and non-urban deployment differs for a given band, which bands are carrying 5G Standalone versus Non-Standalone traffic, which legacy 4G bands are being refarmed for 5G, and which operators have the strongest rural or non-urban footprint in a given technology.
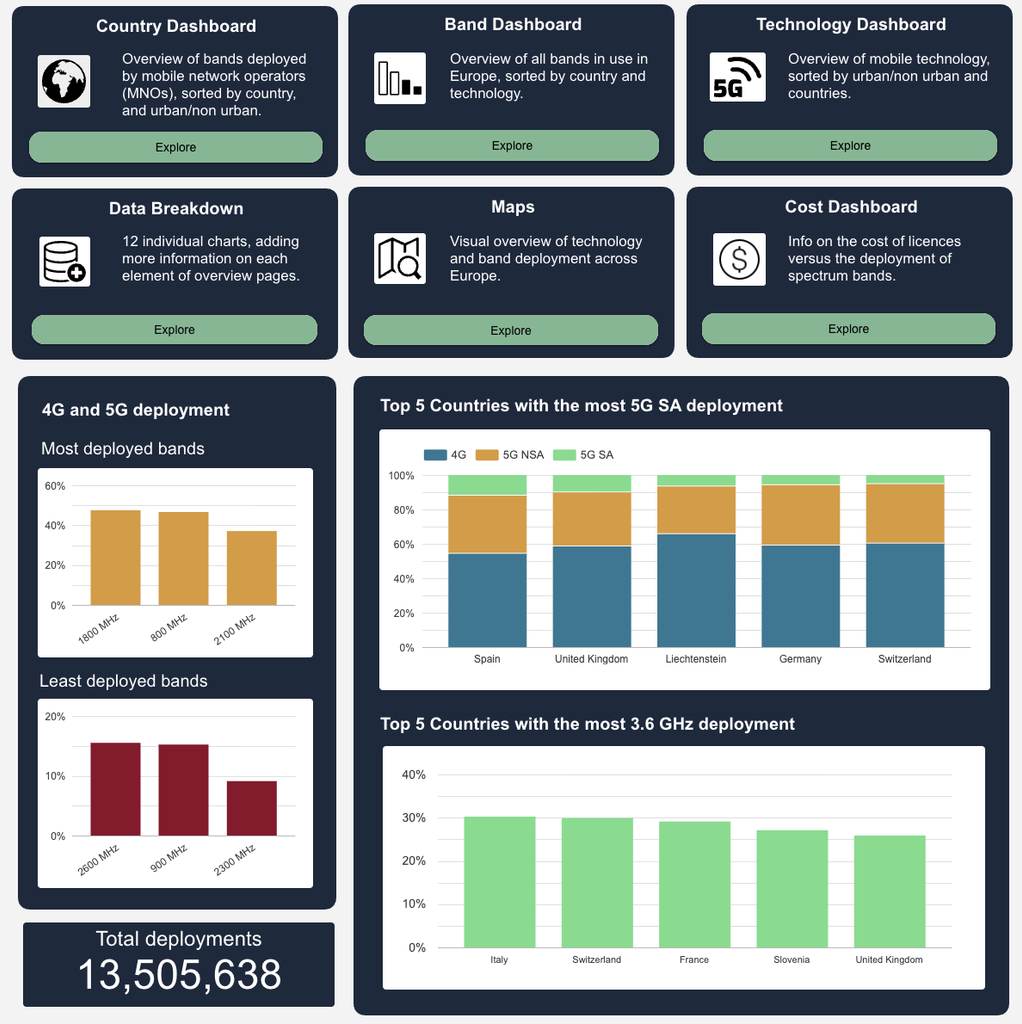
The database is organised into six dashboards:
The Country Dashboard gives an overview of the bands deployed by mobile operators in a market, split by urban and non-urban areas.
The Band Dashboard shows how a chosen frequency band is used across Europe.
The Technology Dashboard breaks deployment down by generation.
The Cost Dashboard combines the deployment data with PolicyTracker’s spectrum pricing records to produce a Cost versus Deployment Index, letting subscribers see, for any operator and band, whether spectrum acquired cheaply is also being used intensively, or whether expensively won spectrum is sitting comparatively idle.
A Data Breakdown section offers twelve further charts drilling into individual elements,
The interactive Maps view visualises band and technology deployment geographically.
To find out more and access the demo version of the database, please download our brochure. The free demo version has the full set of dashboards and filters, but the data is restricted to Luxembourg, Liechtenstein and Andorra. It is accessible to PolicyTracker subscribers.
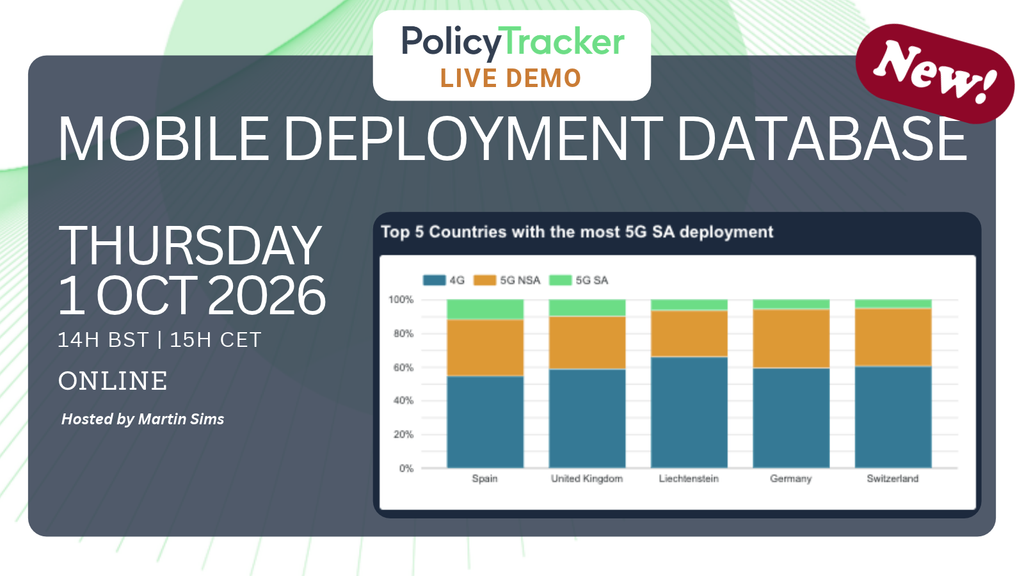
We are also hosting a live demonstration webstream on 1 October 2026 at 14:00 BST / 15:00 CET, led by Martin Sims, where we will walk through the dashboards, the underlying methodology, and take questions from attendees. Sign up for the live demonstration here or by clicking on the banner below.
If you have questions in the meantime, or would like to discuss a subscription, contact us at database@policytracker.com.
Laura is the News Editor at PolicyTracker. Her work is focused on spectrum policies in Europe. She has previously written for The Guardian, Deutsche Welle and several Belgian publications such as the VRT and Knack. Laura is fluent in English, Dutch and French and has a master's degree in International Journalism from City University of London.