Training
Understanding Modern Spectrum Management
An overview of the key engineering, legal and policy issues
Read more
An explanation of how the upgraded version of the SignalTracker app works; how the maps and charts are calculated; what data is collected and how this is used.
The app is designed to measure mobile network performance, including signal strength, radio technology and speed-test performance, at the locations where tests are carried out. To show graphs and charts about individual usage SignalTrackerPro needs to collect your Google account email, but this is not shared and research never identifies individual users.
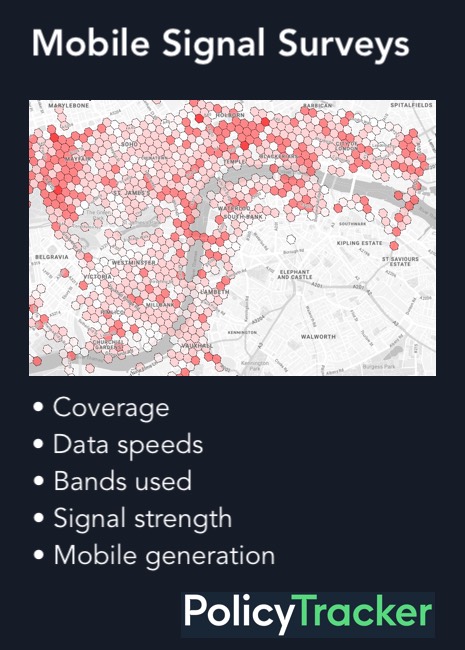
The maps and graphs only show data the app has collected relating to mobile networks. They are primarily based on either serving cell signal strength data or speed tests results, as explained below.
| Map or graph | Primary data source |
| Operator performance | Serving cell signal data |
| Map: signal strength | Serving cell signal data |
| Map: speed tests and technology | Speed test results |
| Coverage map and speed graph | Speed test results |
Where maps are shown, the app also uses the location associated with each test or signal measurement so that results can be displayed geographically.
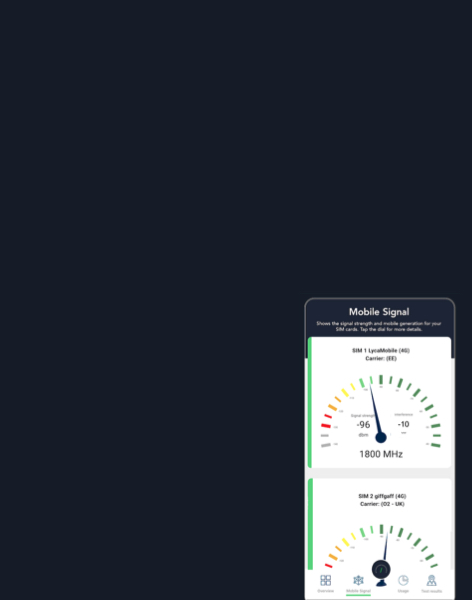
The Operator Performance graphs and the Signal Strength Map are based on the categorisation of the mobile signal power of the serving cell as Good; Moderate; Usable; or Poor or nonexistent.
4G and 5G
| Coverage | dBm |
| Good | -95 and above |
| Moderate | -105 to -95 |
| Usable | -115 to -105 |
| Poor or nonexistent | less than -115 |
In 4G the dBm figures come from the RSRP (Reference Signal Received Power) reading and in 5G from the SS-RSRP result.
The Australian Communications and Media Authority (ACMA) recommended a similar categorization for mobile network coverage maps after a review of existing international approaches. (See p22)
2G and 3G
For 2G and 3G networks the signal strength rating is based on RSSI (Received Signal Strength Indicator) signal power readings where available.
| Coverage | dBm |
| Good | -80 and above |
| Moderate | -80 to -90 |
| Usable | -90 to -100 |
| Poor or nonexistent | less than -100 |
This categorisation is based on several sources, including this academic article, Venn, Digicel and Teltonika.
Overview
Clicking on the dots in the Signal Strength Map gives a figure in dBm which will either come from the RSRP field in the case of 4G and 5G or from the RSSI field in the case of 2G and 3G.
The Operator Performance graphs, and the Signal Strength Map show the data given about mobile technology from the serving cell of the SIM cards used in the handset.
The other two tabs, Map: speed tests and technology and Coverage map and speed graph are based primarily on the app’s own speed-test records. These are combined with handset radio-layer data, including the serving cell and observed radio frequencies, to categorise the mobile technology more precisely.
| Mobile technology | Description | Data sources |
| 2G | Mainly used for voice, SMS and low-speed data | Test results and serving cell |
| 3G | Supports voice and mobile internet but slow speeds | Test results and serving cell |
| 4G | LTE-based mobile broadband technology providing faster data speeds and lower latency | Test results and serving cell |
| 4G with 5G icon | Handset displays 5G icon, but data only shows 4G connections | Test results; serving cell; other observable cell data. |
| 5G NSA (non-standalone) | Uses a 4G anchor connection | Test results; serving cell; other observable cell data. |
| 5G SA (standalone) | End to end 5G architecture without a 4G anchor connection | Test results; serving cell; other observable cell data. |
Our aim is to model the likely customer experience, so for downloads and uploads the app measures the average transmission speed at which data is downloaded over a 20 second period. It does not show the maximum speed of the network, but this can be estimated by watching the real-time Mbps shown during a manual speed test.
During the tests the app connects to Netflix servers, which are widely distributed around the world with good connections to the internet backbone. Generally this is a good approximation for the speeds achieved by well-resourced websites in most countries.
Results may differ from other speed-test services because different services use different servers, routing, congestion conditions and test methods.
In background auto-test mode speed tests are taken approximately every minute. Signal strength readings are taken every 10 seconds.
SignalTracker data is used to give average signal strength and download speed data for different settlement types, namely rural areas, suburban areas and inner cities. This is based on tests from the following sample areas in the UK:
To conserve battery charge the app can be closed and the tests will continue in the background for the chosen length of time. This consumes less energy than having the app open.
The amount of data used per test depends on the speed of the network. At 50 Mbps each test uses approximately 250 MB of data including upload and download, at 10 Mbps the total is about 50 MB.
Correct: the maps and graphs only show the results of tests and measurements which you have carried out. No other data is shown. Other users cannot see your individual test results through their own SignalTrackerPro account. PolicyTracker research uses aggregated and anonymised results and does not identify individual app users.
To operate the software platform, we collect the Google account email address used to create a SignalTrackerPro account. This is required for technical purposes, including account access, authentication, user support, and ensuring that test results are associated with the correct account.
The Google account email address is stored securely and access is restricted. It is not sold or shared with third parties and it is not used in PolicyTracker research outputs. Research and reporting are based on aggregated and anonymised results, so individuals are not identified.
We also collect IP addresses and related technical information for security, diagnostics, service operation, and network performance analysis. Where IP address information is used for research or reporting, it is used only in aggregated or anonymised form and is not used to identify individual users.
Our principle is to collect the minimum personal data needed to operate the software and not to use personal data to identify individuals in our research or reporting. The app’s privacy policy is available here.
An overview of the key engineering, legal and policy issues