Training
Understanding Modern Spectrum Management
An overview of the key engineering, legal and policy issues
Read more
About the tabs; manipulating the data and using the filter function.
The worksheet
Information on the Database is divided into several sub-sheets. The sheets are as follows:
| Allocations | A list of spectrum allocated to mobile broadband by regulatory authorities |
| Assignments | A list of spectrum licences awarded to licensees |
| Operators | A breakdown of the spectrum holdings of all licensees featured in the database |
| Countries | A breakdown of how much spectrum regulatory authorities have allocated to mobile |
| MHz per pop | MHz per pop calculatation for all licences features in the database, converted to USD |
| Expiry | A breakdown of when each licensees spectrum licences are due to expire |
| Pop data | Population data by country |
| Pop density ranked | Population data and density |
| Pop density by category | Population data and density by category |
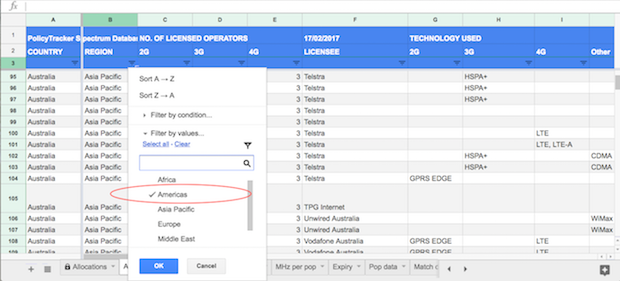
Example: finding 800 MHz frequencies in the Americas
Select “Americas” from the drop-down menu in the “regions” column:
Then select “800 MHz” from the drop-down menu in the “Band” column:
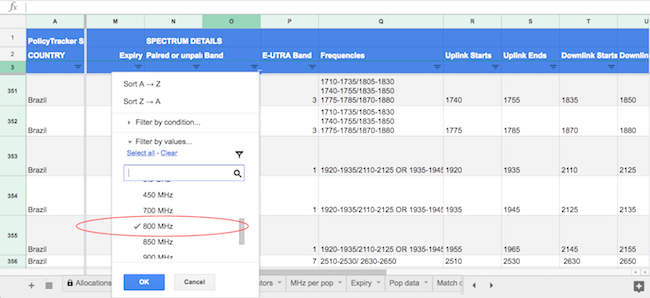
This will bring up entries for all 800 MHz spectrum licenses in the Americas. You can use as many autofilter selections as necessary, allowing you to drill down to find the data you need.
Please note that the MHz per pop sheets show a historic figure using the dollar exchange rates at the time and a current figure, using this year’s exchange rates.
Which figure you choose will depend on your chosen methodology – see this page for a more detailed discussion of this issue.
An overview of the key engineering, legal and policy issues