Training
Understanding Modern Spectrum Management
The key engineering, legal and policy issues
Read more
The following Webinar is a tutorial of our Data Explorer. It may help answer questions you may have about functionality. If you need more help, contact database@policytracker.com.
The Data Explorer is an interactive tool which visualises key metrics relating to national spectrum assignments and spectrum pricing. All data is sourced from the PolicyTracker Spectrum Database.
It is designed to answer questions our subscribers might have about spectrum assignments and spectrum pricing. You may find it useful for benchmarking the price of certain bands or comparing spectrum assignments in different countries.
It is divided into four separate pages:
Scroll down to see a brief guide for each page. If you need more help, don’t hesitate to contact us at database@policytracker.com.
Shows which spectrum licences are assigned to mobile network operators (MNOs) in a particular country.
How to use
Once you have selected a country, data will appear on the page. The figures in the “Key facts” box will also reflect your selection.
The charts in the blue box on the top of the page show you more general data about who has the most spectrum holdings, filtered by low, mid and high band spectrum, and total spectrum.
Scroll down to the green section of the page to see which specific bands each MNO owns licences in. The final table at the bottom of the page shows details of all licences individually.
Displays a table and chart that show auctions/awards held in a country and what each raised in total. Sorted by year.
How to use
Once you have selected a country, data will appear on the page. The figures in the “Key facts” box will also reflect your selection.
Scroll down to see the data in a table format. This table includes additional columns that inform you how each procedure relates to the average global price for that band.
Displays the average price of a particular spectrum band, sorted by country.
How to use
Once you have selected a band, data will appear on the page. The figures in the “Key facts” box will also reflect your selection.
The blue square on the right hand side displays the Global average band price in USD/MHz/Pop. This will remain the same, even if you filter out certain countries or regions, allowing you to compare average prices in a specific region or country to the global average.
Charts and tables
The big bar chart at the top of the page shows the average price (in USD/MHz/Pop) for this band by country. If you want to see individual assignments, click the small downward facing arrow on the top right of the bar chart.
Once clicked, you will see more details about which specific assignment procedures (i.e. auctions) attained which price. You can also click, hold and drag across the chart to zoom in to a specific section.
The final table at the bottom gives you more details of all awards that have taken place in a certain band. This includes auctions as well as other procedures such as beauty contests. It is sorted by $/MHz/Pop but also displays the total price paid in the award to give you a sense of the scale of each award.
Displays a list of countries that have assigned a particular spectrum band
How to use
Once you have selected a band, data will appear on the page. The figures in the “Key facts” box will also reflect your selection.
The chart at the bottom of the page will show you when licences are due to expire and when licences were issued.
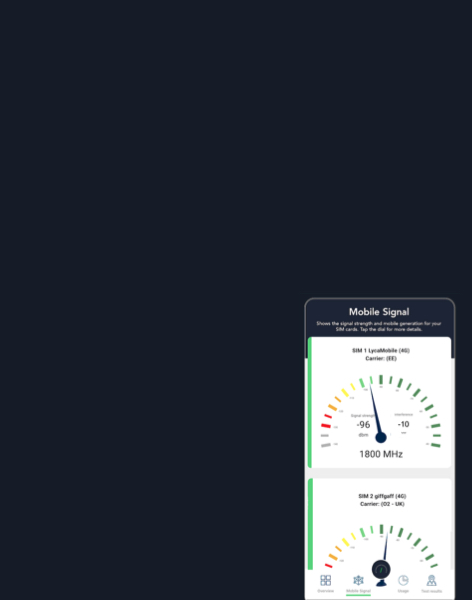
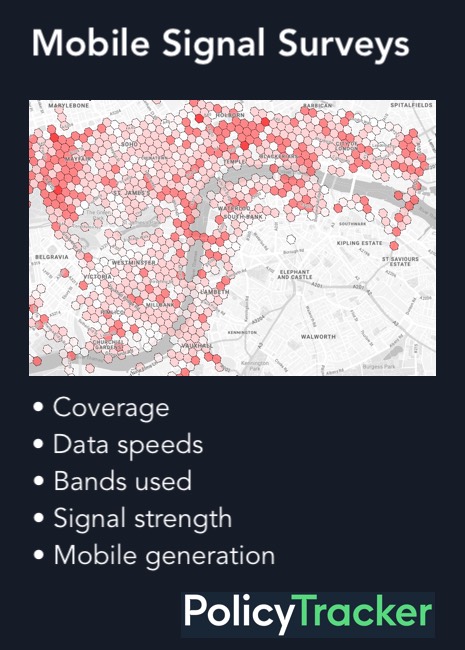
Displays a list of spectrum bands and their corresponding average download speed. Data on this page is sourced from our partner SignalTracker.
How to use
Displays average download speeds of different mobile technologies, such as 2G, 3G and 5G. Data on this page is sourced from our partner SignalTracker.
How to use
Browse the different technologies and their corresponding average speed. To see how many test results were captured to generate this average, hover your mouse over each bar individually.
The key engineering, legal and policy issues